In today’s molecular biology, it is difficult to imagine a tool more versatile, sensitive, and indispensable than qPCR. From diagnosing viral infections on a global scale and studying gene expression in cancers to food quality analysis – qPCR (also known as Real-Time PCR) has become the gold standard’.
From PCR to qPCR
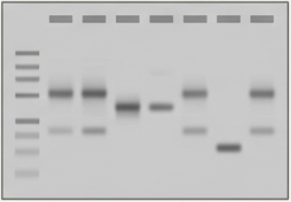
The classic PCR method, developed in the 1980s by Kary Mullis, revolutionised science by enabling the selective amplification of DNA fragments. However, it had a significant limitation: it was an end-point method. This meant that a researcher could only evaluate the result after all cycles were completed, usually by means of gel electrophoresis. This method allowed for the detection of a gene’s presence, but not its initial quantity.
qPCR (quantitative PCR) is also known as Real-Time PCR. It enables the monitoring of product accumulation during the reaction, in every single cycle. Thanks to the use of fluorescent markers, the intensity of the signal is proportional to the amount of DNA produced. This allows for the precise determination of how many template molecules were present in the starting sample.
How does qPCR work?
The foundation of qPCR is the ability to convert chemical DNA synthesis into a measurable physical signal. Currently, two main detection strategies are used:
Intercalating dyes (e.g. SYBR Green I)
This is the most economical and universal solution. SYBR Green dye binds non-specifically to every double-stranded DNA (dsDNA) molecule. In its free state, it exhibits minimal fluorescence.Fluorescence increases drastically upon binding to the minor groove of the DNA helix.
- Advantage: No need to design specific probes for every gene.
- Disadvantage: Low specificity – the dye also fluoresces in the presence of primer dimers or non-specific products. To confirm reliability, a melting curve analysis is essential.
Hydrolysis probes (e.g. TaqMan)
This method is based on the FRET (Förster Resonance Energy Transfer) phenomenon. A probe is a short section of DNA complementary to a fragment within the amplified sequence, labelled at its ends with two molecules:
- Reporter (R): A fluorophore that emits light.
- Quencher (Q): Absorbs energy from the reporter as long as it is in close proximity.
During elongation, DNA polymerase (possessing 5′-3′ exonuclease activity) encounters the probe and degrades it. The released reporter moves away from the quencher, resulting in the emission of a measurable fluorescent signal.
- Advantage: Extremely high specificity and the possibility of multiplexing (detecting several genes in one tube thanks to different reporter colours).
Anatomy of the amplification curve and the quantification cycle (Cq)
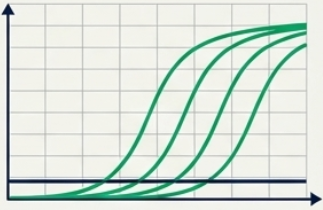
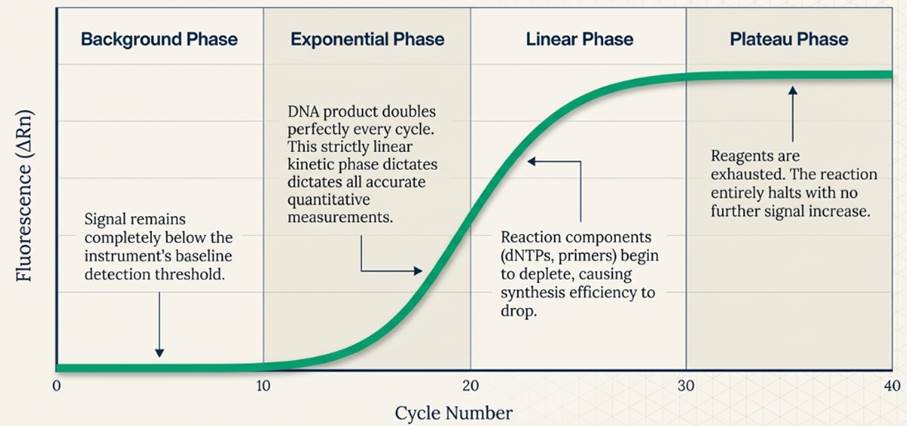
The result of a qPCR reaction is a graph showing the relationship between fluorescence intensity and the cycle number. A typical curve is sigmoidal and is divided into phases:
- Baseline phase: Fluorescence is below the device’s detection threshold.
- Exponential phase: The product doubles in every cycle (at 100% efficiency). This is where measurements are taken.
- Linear phase: Reaction components (dNTPs, primers) begin to be depleted.
- Plateau phase: The reaction ceases; there is no further increase in signal.
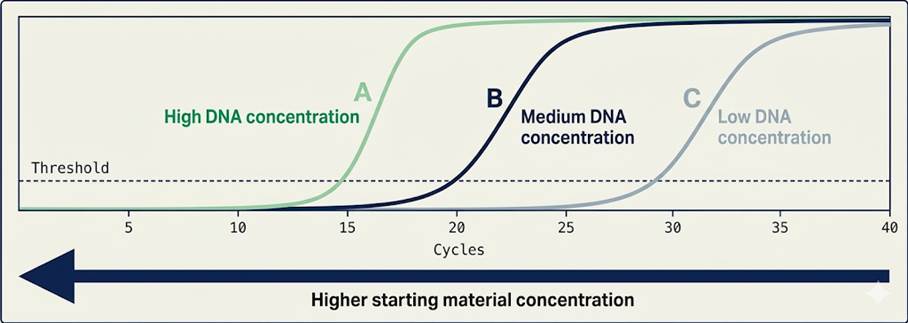
The parameter used for quantification is Cq (Quantification Cycle). It is also referred to as Ct (threshold Cycle). This is the cycle in which the fluorescence signal crosses the threshold line and becomes statistically significant above the background noise.
Mathematical relationship: The more matrix DNA in the sample, the earlier the rise in fluorescence occurs. The Cq value is lower.
Quantification strategies
When performing qPCR, you can choose between two approaches for quantifying your samples.
Absolute Quantification
Used when the exact number of DNA copies in a sample must be known (e.g. viral load in blood). This requires the preparation of a standard curve using serial dilutions of a standard with a known concentration. By comparing the Cq of the test sample with the standard curve, a specific number of molecules is determined.
Relative Quantification
Most commonly used in gene expression studies. We are not interested in the number of copies, but rather the change in mRNA levels in the test group relative to a control group. To eliminate pipetting errors and differences in RNA quality, reference genes (so-called housekeeping genes, e.g. GAPDH, ACTB) are used, as their levels in the cell remain constant.
The most popular calculation method is the Livak formula:

In order to demonstrate the difference between the study group and the control group, the following formula is used.

The result indicates the fold change in the expression level of the gene under study.
Applications of qPCR
The versatility of qPCR makes it a technique present in almost every field of life sciences:
- Medical diagnostics: Detection of pathogens (HIV, HCV, SARS-CoV-2, Mycobacterium tuberculosis).
- Oncology: Monitoring minimal residual disease and assessing oncogene overexpression (e.g. HER2 in breast cancer).
- Forensic genetics: Quantifying human DNA in secured biological traces before STR profiling.
- Food testing: Detecting genetically modified organisms (GMOs) and identifying allergens or composition fraud (e.g. presence of horsemeat in beef products).
- Molecular ecology: Analysis of eDNA (environmental DNA) for monitoring rare species based on DNA fragments left in water.
Best practices and quality control (MIQE Guidelines)
To ensure qPCR results are reliable and reproducible, the scientific community developed the MIQE guidelines (Minimum Information for Publication of Quantitative Real-Time PCR Experiments). Key aspects include:
- Reaction efficiency (E): Should range between 90–110%. Perfect efficiency (E=2) means that the amount of DNA doubles exactly every cycle.
- Template purity: Chemical contaminants (e.g. phenol, ethanol, salts) can inhibit polymerase and artificially increase the Cq value.
- Negative controls (NTC): A sample without DNA template to rule out reagent contamination.
- Melting curve analysis: In the case of SYBR Green, a single, narrow peak ensures that only one, correct product is being amplified.
Summary
The qPCR method is a powerful tool that has transformed biology from a descriptive science into a precise quantitative discipline. Although technically based on the simple phenomenon of fluorescence and enzymatic DNA synthesis, its correct use requires a deep understanding of reaction kinetics and rigorous data analysis. In the era of personalised medicine and growing epidemiological threats, the role of qPCR will only increase, forming the foundation of modern bioanalytics.
Literature:
- Bustin, S. A., et al. (2009). The MIQE guidelines: Minimum information for publication of quantitative real-time PCR experiments. Clinical Chemistry, 55(4), 611-622.
- Higuchi, R., Fockler, C., Dollinger, G., & Watson, R. (1993). Kinetic PCR analysis: Real-time monitoring of DNA amplification reactions. Bio/Technology, 11(9), 1026-1030.
- Kubista, M., et al. (2006). The real-time polymerase chain reaction. Molecular Aspects of Medicine, 27(2-3), 95-125.
- Livak, K. J., & Schmittgen, T. D. (2001). Analysis of relative gene expression data using real-time quantitative PCR and the 2−ΔΔCT method. Methods, 25(4), 402-408.
- Pfaffl, M. W. (2001). A new mathematical model for relative quantification in real-time RT-PCR. Nucleic Acids Research, 29(9), e45.