
Every analyst performing column chromatography comes across the concept of theoretical plates. This parameter says a lot about the chromatographic column and its condition. If you have read ‘Introduction to HPLC’, you know that a chromatography column does not contain any plates. So what are theoretical plates and how do they affect separation? You will find out in this article.
The Game of Resolution
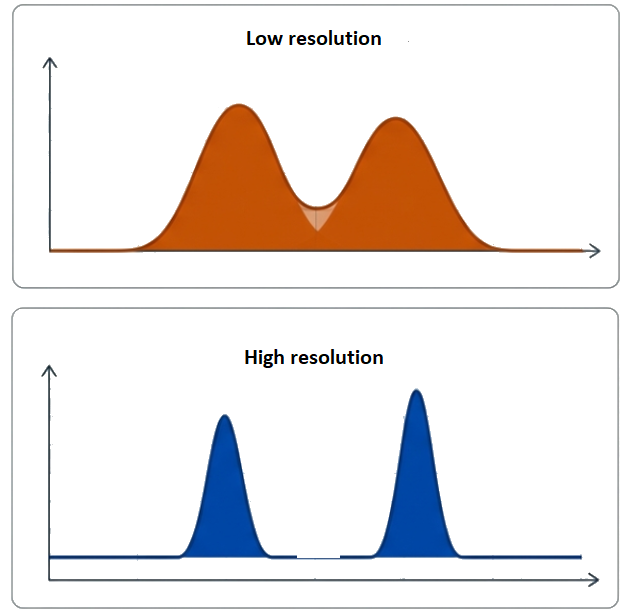
Resolution (Rs) is the holy grail of chromatography. This parameter tells us whether two components of a mixture have left the column separately or merged into a single unreadable signal.
Three factors influence resolution: retention (how long substances remain on the column), selectivity (how much they ‘like’ the stationary phase relative to each other) and efficiency. It is efficiency – the ability of the column to maintain a narrow band of substances – that forms the basis of the shelf theory.
What are theoretical plates?
When we hear about ‘plates’ inside a column, our intuition tells us to think of physical steps or partitions. Nothing could be further from the truth. Theoretical plates are mathematical abstractions.
Let us imagine that the chromatographic process is a series of successive discrete extraction stages. A molecule of a substance comes into contact with the stationary phase. Equilibrium is established, and then the mobile phase moves it one step further to the next ‘micro-stage’. The more such steps (plates) we can fit into the column, the better the separation will be.
The Legacy of Martin and Synge: The Distillation Model
In 1941, Archer Martin and Richard Synge (later Nobel laureates) proposed a model based on the fractional distillation process. At that time, distillation was the best-described separation process, and distillation columns actually had physical shelves (plates).
Martin and Synge attempted to describe the behaviour of a chromatography column as if it were a distillation column. In this model, the substance moves down the column in a series of discrete steps.
On each “plate” the moving and stationary phases are in perfect balance.
Although this model was brilliant in its simplicity, it had one major drawback: it was static. It assumed that equilibrium is reached immediately, which is impossible in the actual flow of liquids or gases.
Column efficiency: N and H parameters
To describe the performance of a column, we use two key parameters:
Number of theoretical plates (N)
The higher the N value, the more efficient the column and the narrower the peaks. We calculate it from the chromatogram based on retention time (tR) and peak width (w):
As can be easily seen, the number of theoretical plates will be characteristic for a specific substance and separation conditions, and even for a specific apparatus. Therefore, it is important to always determine it under the same conditions.

Height equivalent to theoretical plate (H or HETP)
This parameter tells us how “thick” a single plate is. Since the column has a specific length (L), the relationship is simple:
Analytical objective: We want H to be as small as possible. A low H value means that more plates can fit into each centimetre of the column. It translates into higher efficiency.
The Van Deemter equation, or how to control productivity
In 1956, Dutch engineer Jan van Deemter and his colleagues noticed that a static model was not enough. In reality, analyte molecules do not wait patiently for equilibrium to be established – they are in constant motion, diffusing and colliding with the filling elements.
Their Kinetic Theory of Dispersion is described by the equation:
Where u is the linear velocity of the mobile phase. The equation describes the relationship between flow velocity and column efficiency. However, in addition to flow, three components can be observed that are closely related to the column design. These three components are three different types of diffusion that occur during separation.
Equation Components:
- Component A (Eddy diffusion): This results from the fact that molecules can choose different paths between the filler grains. Some flow along the ‘motorway’, while others meander along side streets.
- How can it be minimised? By using smaller and more uniform filling granules. In short, member A is characteristic of a given column. To reduce it, use a column with lower granularity or a column with Core-shield granules.
- Component B (Longitudinal diffusion): Molecules naturally tend to spread from areas of high concentration to areas of low concentration (along the column). This effect dominates at low flow rates.
- Component C (Mass transfer resistance): The molecule needs time to enter and exit the stationary phase. At high flow rates, the mobile phase “escapes” too quickly before the molecules have time to exchange between phases.
Optimisation of separation in practice
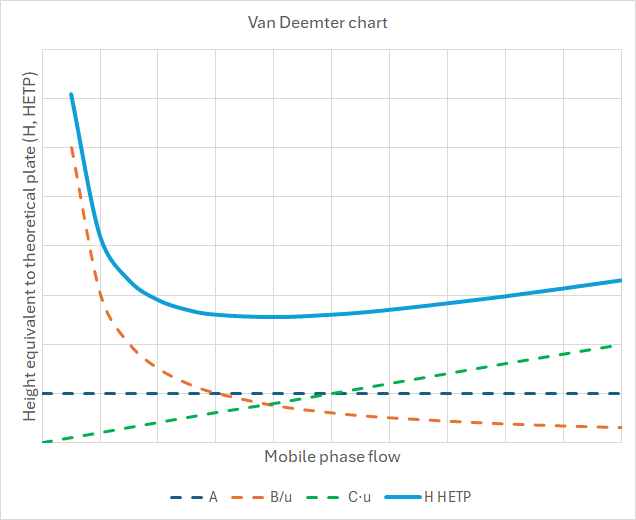
The graph showing the relationship between H and flow velocity is known as the van Deemter curve. Understanding the van Deemter curve is the key to becoming a master of optimisation.
Searching for the Minimum
The curve H = f(u) has a ‘U’ shape. There is an optimum flow velocity (uopt) at which the value of H is lowest (i.e. the column efficiency is highest). Operating at this velocity, result in the best possible separation for a given column.
GC vs LC: The Great Diffusion Battle
In gas chromatography (GC), the diffusion of molecules in the mobile phase (gas) is thousands of times faster than in liquid.
- In GC, component B (longitudinal diffusion) is very important.
- In liquid chromatography (LC), it is the C component (mass transfer) that is the main bottleneck. Therefore, in modern UHPLC (or UPLC) technology, extremely small particles (below 2 μm) are used to shorten the diffusion path and ‘flatten’ the Van Deemter curve. This allows for very fast flows without loss of efficiency.
Column vitality monitoring
As the column is used, its separation capacity decreases. It is worth monitoring this, and theoretical plates are ideal for this purpose. The graph below shows the relationship between the number of theoretical plates and the number of analyses performed on the column. By monitoring this parameter, you can predict the wear and tear of the column and replace it at the right time.
Summary: The Golden Mean
The plate theory and Van Deemter’s equation are not just mathematical curiosities. They are the foundations that allow us to understand that:
- A longer column is not always the solution (because time and pressure increase).
- Faster flow saves time but can ruin the resolution (through component C).
- Smaller grains almost always mean better efficiency (improvement in components A and C).
As analysts, we are always looking for a compromise between quality (high N, low H) and time efficiency. Thanks to Van Deemter, we know exactly where that compromise lies.