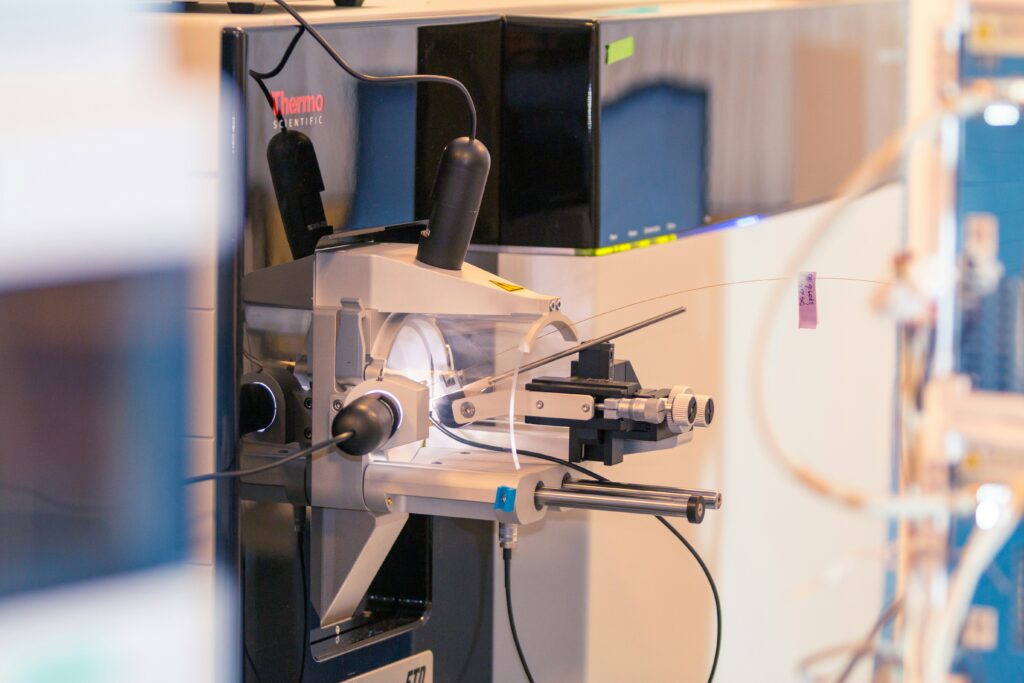
To oversimplify, a mass spectrometer is a rather large scale used to measure something very small – individual molecules. This is not only a gross oversimplification but also a lie. Mass spectrometry (MS) is a technique that enables us not only to determine the mass of molecules but also to detect trace amounts of them in highly complex matrices, as well as to delve into the structure of chemical compounds. And although today the technique is mainly used for analytical purposes, in the past it was used to enrich uranium during the Manhattan Project.
What exactly does a mass spectrometer measure?
Contrary to common, simplified terminology, a mass spectrometer does not directly measure molecular mass (M). The instrument measures the ratio of an ion’s mass to its charge, denoted by the symbol m/z (where m is the ion’s mass in daltons and z is the number of elementary charges).
For a measurement to be possible, the molecule must undergo two processes:
- Ionisation: The process of imparting a charge (positive or negative).
- Transition to the gaseous phase: The molecules must be able to move freely in a vacuum, without colliding with air molecules.
The result of the measurement is a mass spectrum – a two-dimensional graph in which the x-axis represents the m/z value and the y-axis represents the signal intensity, corresponding to the abundance of ions with a given m/z value. By knowing the charge (z) and having a precise m/z measurement, the researcher is able to calculate the molecular mass of the analyte under investigation with great accuracy.
The measurement mechanism in mass spectrometry
Mass spectrometry is based on the ability of electrically charged particles to move in an electric field. Electrophoresis also makes use of this same property. In mass spectrometry, there are even more interactions involved, as magnetic interactions are also utilised.
In short, the physical basis of mass spectrometry is the interaction of charged particles with electromagnetic fields. When an ion of mass m and charge z moves through a vacuum, it is subject to the Lorentz force:

Where:
- E is the electric field strength,
- B is the magnetic field induction,
- v is the speed of the ion.
By adjusting the electric field strength and the magnetic field induction, the movement of ions can be controlled as follows:
- Speed control
- Control of movement direction
- Detention (trap)
This enables the mass spectrometer to separate ions based on their mass-to-charge ratio (m/z). The separated ions reach the detector individually, which counts a signal directly proportional to their quantity.
Stages of analysis in a mass spectrometer
Ionisation
Most molecules are electrically neutral. The first step is therefore to impart an electric charge to them. This process takes place in the part of the spectrometer known as the ion source. There are many types of ion sources, which will be discussed separately. They are not universal and are suitable for specific types of molecules. It is in the ion source that neutral molecules acquire a charge (z). Depending on the structure of the molecule, there may be more than one charge. Another process also takes place in the ion source. Ions transition to the gaseous phase, which enables them to move within an electromagnetic field.
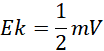
Acceleration (Electric Field)
In the initial phase of the process, the ions are accelerated in an electric field. The kinetic energy (Ek) acquired by the ion depends on the applied voltage (V):
Separation
At this stage, the ions that have been set in motion separate. This process takes place in what are known as ion analysers or ion separators. As with ion sources, there are many types of analysers, each designed for different molecules. Their operating principles also differ. For this reason, they will be discussed in a separate article.
A brief history of mass spectrometry
Mass spectrometry is a technique that is over 100 years old.
The history of MS is a chronicle of Nobel Prize-winning discoveries, which began with a desire to understand the structure of matter.
- 1897 – J.J. Thomson: The discovery of the electron and the first experiments with ‘tube rays’ (positively charged ions). Thomson demonstrated that they could be deflected by electric and magnetic fields.
- 1912 – Pierwszy spektrograf mas: Thomson built the first mass spectrometer, which he called a spectrograph. He identified the isotopes of neon, which was a breakthrough – it was demonstrated for the first time that atoms of the same element can differ in mass.
- 1919 – Francis Aston: A student of Thomson, he built a spectrograph with a much higher resolving power, for which he was awarded the Nobel Prize in 1922. He identified over 200 naturally occurring isotopes.
- Lata 40. i 50. XX wieku: The development of MS in the petrochemical and nuclear sectors (the Manhattan Project – magnetic fields were used to separate uranium isotopes).
- Biological revolution (lata 80.): The introduction of ‘soft’ ionisation techniques (ESI and MALDI), which enabled the analysis of proteins and nucleic acids without fragmenting them. In 2002, John Fenn and Koichi Tanaka were awarded the Nobel Prize for this work.
The construction of a modern mass spectrometer
Regardless of its complexity, every mass spectrometer consists of four main modules that work in close coordination:
- Sample introduction system: This may involve direct injection, gas chromatography (GC) or – most commonly in biology – liquid chromatography (LC).
- Ion source: The place where sample molecules are converted into ions in the gas phase.
- Mass analyser: this is where ions are separated according to their m/z values. Modern spectrometers are often equipped with more than one mass analyser, arranged in tandem.
- Detector: It records the number of ions striking its surface and converts this into an electrical signal.
The mass analyser and detector must be operated under high-vacuum conditions (10⁻⁵ to 10⁻¹⁰ Torr). This ensures that the moving ions do not collide with air molecules and their motion remains undisturbed
Sources of ions: How do you ‘charge’ molecules?
The choice of ion source depends on the polarity, mass and thermal stability of the compound under investigation.
Electron Ionisation (EI)
This is a ‘hard’ technique, used mainly for small, stable molecules (e.g. in toxicological studies). The sample is bombarded with a beam of electrons, leading to severe fragmentation. This makes it possible to obtain a ‘molecular fingerprint’ of the molecule.
Electrospray ionisation (ESI)
A key technique in biology. A sample in solution flows through a capillary under high voltage, forming a spray of charged droplets. As the solvent evaporates, the droplets shrink until the ions are ‘pushed’ into the gas phase.
- Advantage: It enables the analysis of large proteins (it produces multiply charged ions, which reduces the m/z value to a range that can be measured by mass spectrometers).
MALDI (Matrix-Assisted Laser Desorption/Ionization)
The sample is co-crystallised with a so-called template (a small organic molecule) and then irradiated with a laser pulse. The template absorbs the energy and transfers it to the analyte, causing its desorption and ionisation.
- Advantage: Ideal for rapid profile analysis (e.g. bacterial identification in clinical diagnostics – MALDI-TOF Biotyper).
Ion analysers: Filters and traps
The analyser determines the resolution (the ability to distinguish between ions of similar masses) and the accuracy of the measurement.
- Quadrupole (Q): Consists of four parallel rods to which a DC and an RF voltage are applied. It acts as a filter – at any given moment, it allows only ions with a specific m/z to pass through. It is inexpensive and fast, but has low resolution.
- Ion trap: An analyser in which ions are trapped. Their residence time depends on their m/z.
- Time of Flight (TOF): Ions are accelerated by the same energy pulse. Lighter ions travel faster and reach the detector sooner than heavier ones. TOF offers a vast mass range and high resolution.
- Orbitrap: The most advanced type of mass spectrometer. Ions orbit around a spindle-shaped central electrode. Their oscillation frequency along the electrode axis is directly proportional to the m/z ratio. The signal is processed using a Fourier transform (FT). It offers ultra-high resolution.
Applications in the life sciences (Proteomics and Metabolomics)
Why is mass spectrometry so important? Because it has revolutionised the way we study cells.
- Bottom-up proteomics: Proteins are enzymatically cleaved (e.g. with trypsin) into peptides, their masses are analysed, and then, using MS/MS (tandem mass spectrometry), the peptides are broken down into amino acids, allowing for their identification and the mapping of post-translational modifications (phosphorylation, glycosylation).
- Metabolomics: Monitoring changes in sugar, lipid or hormone levels in response to medication or disease.
- Imaging mass spectrometry (MSI): This technique enables the mapping of the distribution of specific molecules directly within tissue sections (e.g. to check whether a drug has reached the interior of a tumour).
Summary
Mass spectrometry is a technology that combines the rigorous laws of physics with the infinite complexity of biology. From Thomson’s identification of isotopes to the modern mapping of the human proteome, MS remains the most precise ‘molecular scale’ available to science. For biology students and teachers, understanding m/z, ionisation mechanisms and the differences between analysers is key to comprehending modern scientific publications and the direction of development in personalised medicine.
Literature and soiurces
- Gross, J. H. (2017). Mass Spectrometry: A Textbook. Springer International Publishing. (Podstawowy podręcznik akademicki).
- Siuzdak, G. (2006). The Expanding Role of Mass Spectrometry in Biotechnology. MCC Press. .
- Fenn, J. B., et al. (1989). Electrospray ionization for mass spectrometry of large biomolecules. Science, 246(4926), 64-71.
- Wait, R. (1993). Introduction to Mass Spectrometry. Methods in Molecular Biology, 17 191-213
- Hoffmann, E. de, & Stroobant, V. (2007). Mass Spectrometry: Principles and Applications. John Wiley & Sons.
Graphics
Photo by Bas van Breukelen on Unsplash