UV-VIS spectrophotometry is one of the fundamental analytical techniques that is widely used in life sciences, chemistry and medicine. It allows for the qualitative and quantitative analysis of substances by measuring the absorption (absorption) of radiation in the ultraviolet (UV) and visible light (VIS) range. UV-VIS spectrophotometry can function as a stand-alone tool or as a detection method in other analytical techniques such as HPLC or ELISA.
Why do molecules absorb UV light?
Molecules have the ability to absorb electromagnetic radiation. This is due to electrons circulating around the nucleus of the atom. Electrons circulate around the nuclei of atoms in so-called orbitals, which are related to the energy state. The steady orbital of an electron is the so-called rest state. When the electron absorbs a quantum of energy (e.g. light) it moves to a higher orbital (the excited state). The excited state is usually unstable. The electron therefore quickly returns to the rest state. During the transition to the rest state, it emits energy in the form of heat or light (fluorescence). The transition from the rest state to the excited state is called an electron transition.
Types of electron transitions
In the structure of the atom we can distinguish different types of orbitals
- Binding orbitals σ i π
- Non-binding orbital n
- anti-binding orbitals σ* i π*
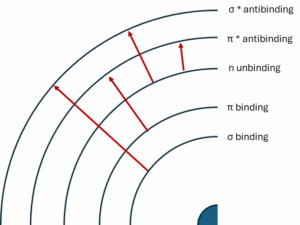
Absorption of UV-VIS radiation by molecules leads to the excitation of electrons from lower to higher energy levels. The type of electron transition depends on the chemical structure of the substance under study. There are several basic types of transitions:
- σ → σ* transitions: Occur in saturated compounds that have only single bonds (σ). These transitions require high energy and therefore occur in the far ultraviolet (below 200 nm).
- n → σ* transitions: Specific to saturated compounds containing atoms with free electron pairs (n), e.g. alcohols, ethers, amines. Require less energy than σ → σ* transitions.
- π → π* transitions: Observed in unsaturated compounds that have double or triple (π) bonds, e.g. alkenes, alkynes, aromatic compounds. These transitions are responsible for the intense absorption bands.
- n → π* transitions: Appear in unsaturated compounds with heteroatoms having free electron pairs, e.g. ketones, aldehydes. They require the lowest energy and are responsible for absorption bands in the near UV and visible range.
Absorption principles
The basis of UV-VIS spectrophotometry is the measurement of the intensity of light passing through a sample. If the sample absorbs the light, the intensity reaching the detector is lower.
A=Log(I0-I1)
I0 – intensity of light entering the probe
I1 – intensity of light reaching detector
The measure of the amount of absorbed light is the absorbance, which is determined from the following formula. The basis for the calculation is Lambert-Beer’s law, which describes the relationship between the absorption of radiation and the concentration of a substance. This law can be expressed by the formula:
A = ε * c * l
where:
- A – absorbance (dimensionless)
- ε –molar absorption coefficient (L*mol–¹*cm–¹) – the characteristic constant for a substance at a particular wavelength. This factor is called the extinction coefficient
- c – molar concentration of the substance (mol/L)
- l – thickness of the absorbing layer
According to this law, absorbance is directly proportional to the concentration of the substance and the thickness of the solution layer. In cuvette spectrophotometers, the thickness of the solution layer is determined by the width of the cuvette.
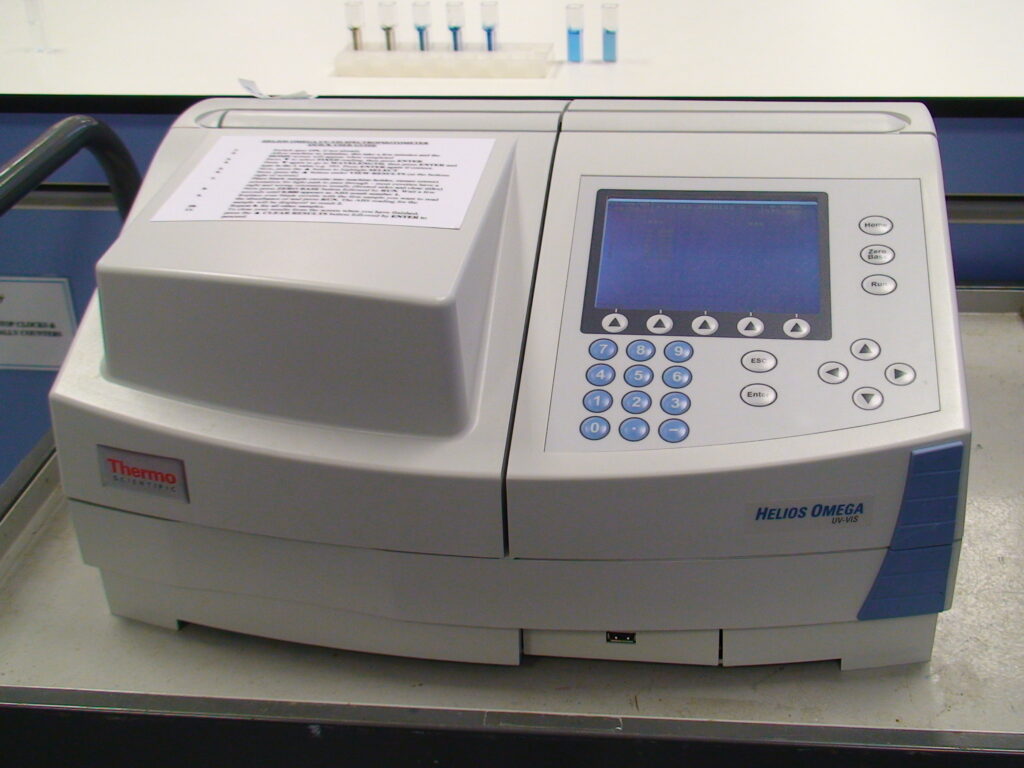
Construction of the UV-VIS spectrophotometer
A typical UV-VIS spectrophotometer consists of the following components:
- Radiation source:
- Deuterium lamp: emits radiation in the UV range (190-380 nm).
- Tungsten or tungsten-halogen lamp: emits radiation in the VIS range (380-900 nm).
- Monochromator: Used to select a specific wavelength from the broad spectrum emitted by the lamp. Diffraction gratings are most commonly used.
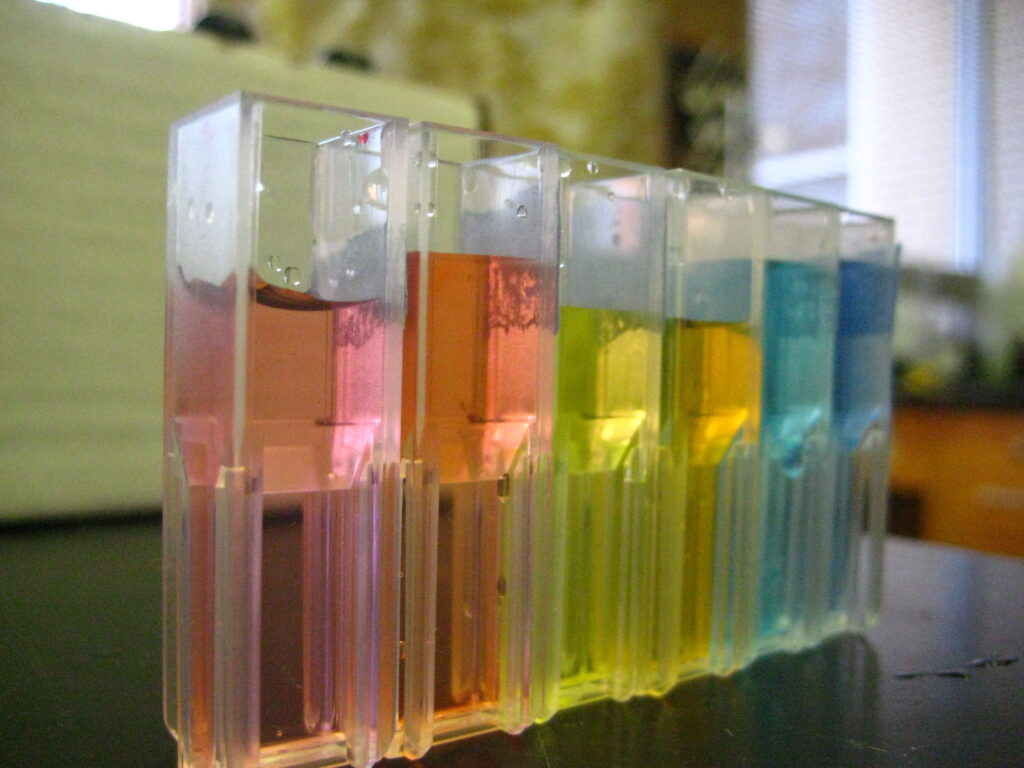
- Cuvette: a vessel in which the sample for analysis is placed. Cuvettes are made of materials that transmit radiation in a given range (glass for VIS, quartz for UV). Cuvettes are usually made of polymer or quartz. Their walls, through which the light beam passes, are transparent.
- Detector: Measures the intensity of the radiation passing through the sample. The most commonly used detectors are photodiodes and photomultipliers.
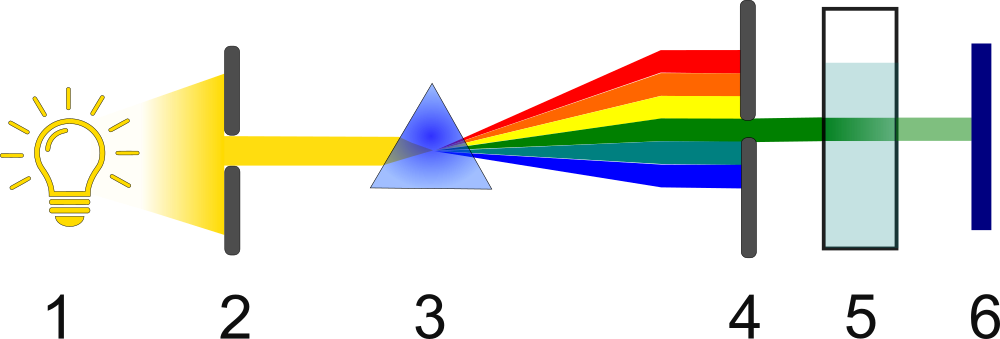
- Light source
- Aperture
- Prism
- Monochromator
- Cuvette
- Detector
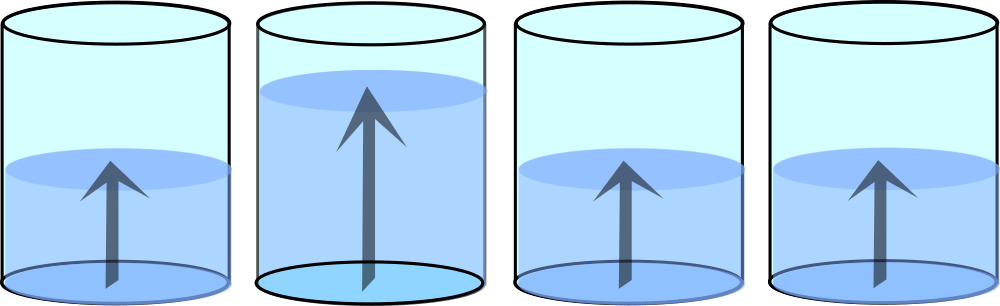
Multi-well plate readers
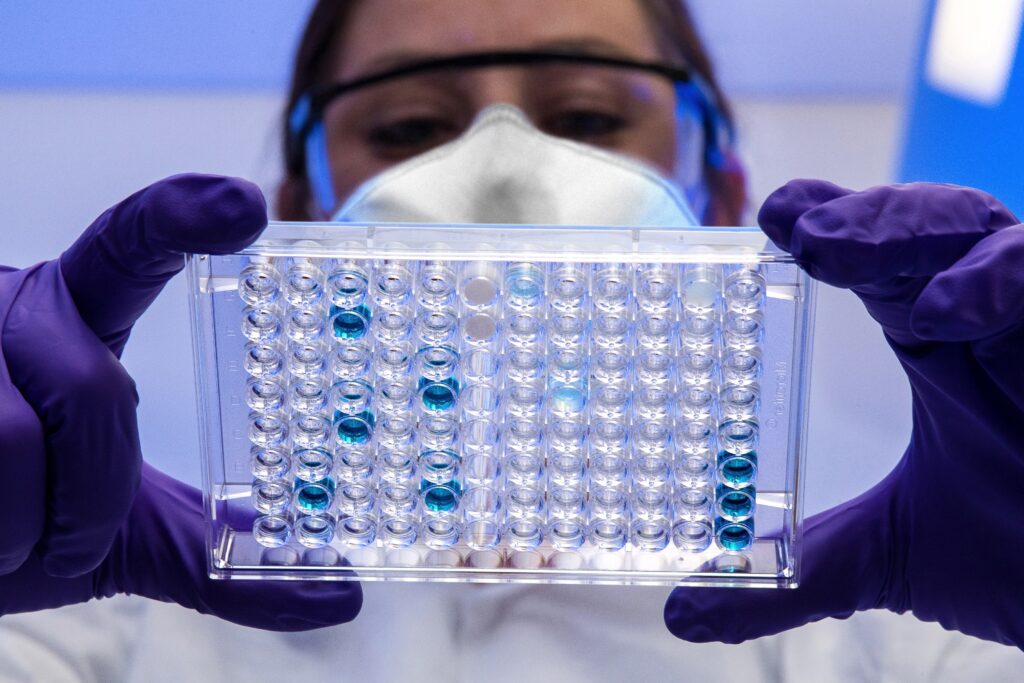
Another type of UV-VIS spectrophotometer is multi-well plate readers. In contrast to cuvette spectrophotometers, in this case the light passes through the bottom of the plate and the detector is above the plate. For this reason, the path depends strictly on the volume of solution in the plate and the measurement is subject to pipetting error. Nevertheless, the use of modern pipettes, their regular calibration and the ability to measure many samples quickly makes this one very popular.
Quantitative analysis in UV-VIS spectrophotometry
Quantitative analysis in UV-VIS spectrophotometry involves determining the concentration of an unknown sample by measuring its absorbance. The most commonly used method is the calibration curve method. It involves preparing a series of standard solutions of known concentrations, measuring their absorbance and plotting the concentration dependence of the absorbance. The absorbance of a sample of unknown concentration is then measured and its concentration read off the calibration curve.
Application in quantitative analysis
UV-VIS spectrophotometry is widely used for quantitative analysis in various fields:
- Biochemistry: determination of proteins, nucleic acids, enzymes.
- Pharmacy: quality control of drugs, determination of active substances.
- Environmental protection: determination of concentrations of pollutants in water and soil (e.g. phenols, heavy metals).
- Food industry: quality control of products, determination of dyes, preservatives.
- Medical diagnostics: determination of bilirubin, glucose, haemoglobin in blood.
Qualitative analysis
The UV-VIS spectrum can be specific to a molecule. By taking a measurement in a certain wavelength range, a spectrum is obtained that reflects the presence of certain chemical bonds and the composition of the molecule. A good example is the difference in the UV-VIS spectrum for haemoglobin and carboxyhaemoglobin. Carboxyhaemoglobin is the result of the irreversible binding of haemoglobin to carbon monoxide (asphyxia). It exhibits a characteristic absorption maximum at 560 nm and a much lower absorbance at 450 nm.
Application in qualitative analysis
UV-VIS spectrophotometry can also be used to identify substances. Every substance has a characteristic absorption spectrum, i.e. a graph of the wavelength dependence of absorbance. By comparing the spectrum of an unknown sample with reference spectra, it can be identified. In addition, spectrum analysis makes it possible to:
- Determination of substance purity: The presence of impurities can cause additional absorption bands to appear.
- Examination of particle structure: The position and intensity of the absorption bands provide information on the presence of specific functional groups and bond systems.
UV-VIS spectrophotometry as a detection method for other techniques
UV-VIS detectors have found wide application in various analytical techniques. They are the most commonly used detector in high-performance liquid chromatography. UV-VIS detectors are used for cell culture monitoring (OD measurement). They are used in colorimetric assays, cellular assays, biochemical assays, ELISA assays. This is made possible by their versatility, simple design, low cost and speed of measurement.
Book references
- Kęcki, Zbigniew. Spektroskopia molekularna. Wydawnictwo Naukowe PWN, 2013, ISBN 978-83-01-10503-7
- Szczepaniak, Walenty. Metody instrumentalne w analizie chemicznej. Wydawnictwo Naukowe PWN, 2008, ISBN 978-83-01-14210-0
Internet sources
- https://www.mt.com/pl/pl/home/library/guides/lab-analytical-instruments/uvvis-spectrophotometry-guide-applications-fundamentals.html
- https://derangedphysiology.com/main/cicm-primary-exam/respiratory-system/Chapter-126/spectrophotometry-carboxyhaemoglobin
- Wikipedia – Wolna Encyklopedia: .
Graphics